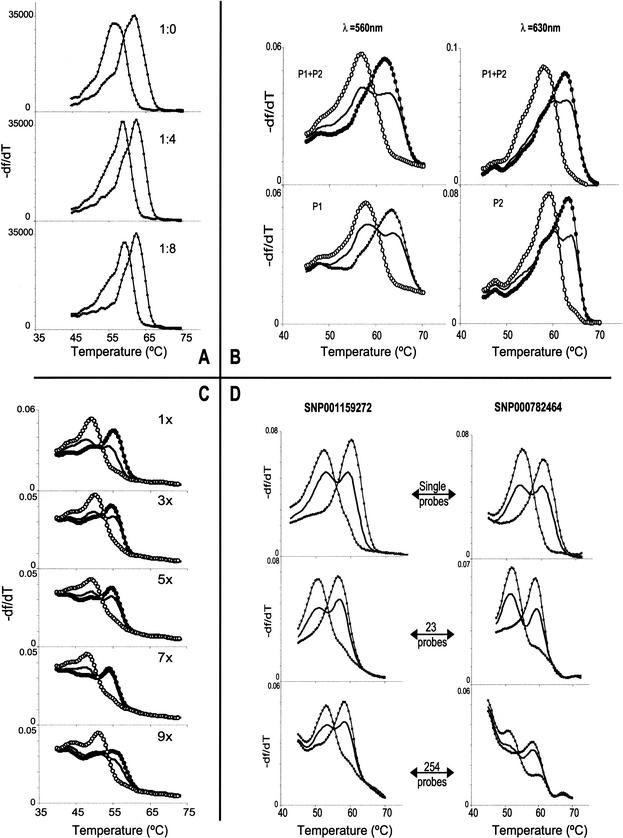
Figure 4.
Experiments into aspects of DASH-2 multiplexing are illustrated. Different genotypes are distinguished by line style, with equivalent genotypes per panel using the same line style. For each image the df/dT scale is in platform-dependent arbitrary units. (A) Robustness of signal strength and quality when multiplexing the PCR were demonstrated by modeling the presence of competing target molecules. The stated ratios indicated the amount of true target versus other DNAs coimmobilized within an array feature and assayed for the true target by DASH-2. (B) The viability of spectrally multiplexing iFRET probes is shown by these example genotypes, produced by DASH-2 analysis of a duplexed PCR. Targets were SNP000574304 and SNP000003618, and the matching probes were P1 (carrying Bodipy TMR: 560nm emission) and P2 (carrying ROX: 630nm emission), respectively. The probe combinations used for DASH-2 analysis are shown in each cell. The same DNA samples are assayed in the top and bottom cells. The left two cells were imaged through a 560-nm filter, while the right two cells were imaged through a 630-nm filter. (C) The potential for serial interrogation of membranes was established by comparing DASH-2 melting curves from replica arrayed samples after probing for the number of times indicated in the corner of each cell. (D) The extent to which probe cocktails may be used to examine different markers at different feature positions was explored by assaying arrayed single-plex PCRs for 24 SNPs (two examples shown, as left and right columns of cells); probe complexities are as indicated. Most markers suffered only a minimal loss of data quality regardless of the probe cocktail complexity (left column example), while three SNPs acquired extra early-melting fluorescence when interrogated by the 254-probe mixture (right column example).

