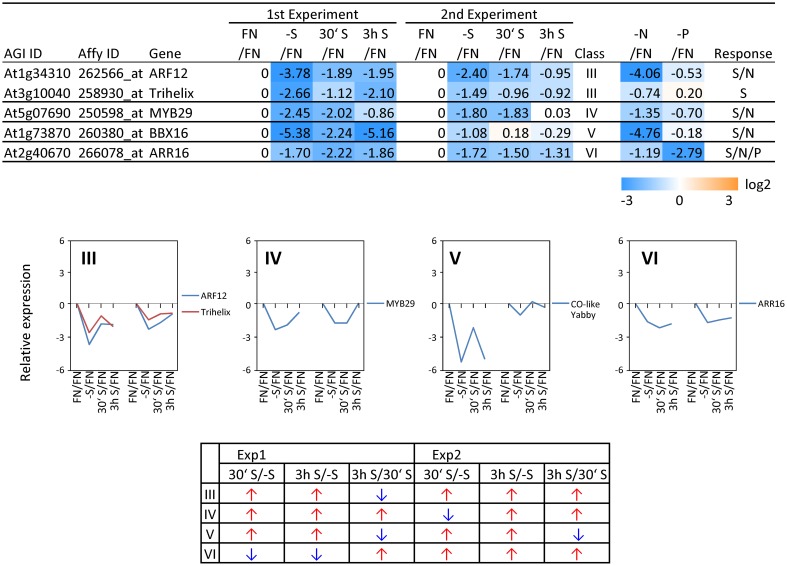
Figure 6.
Relative expression level of down-regulated transcription factors (TFs) under sulfate starvation. Transcription factors were down-regulated more than 2 times (5 genes) under sulfate deficient conditions in both experimental replicates. The down-regulated transcription factors were classified into the same 7 clusters as Figure 4 (class I–VI, and others) according to responsiveness to sulfate resupply as indicated by fold changes (>1, upwards arrow; <1, downwards arrow) in transcript accumulations, 30′ (30 min) S/-S, 3 h S/-S and 3 h S/30′ S (Supplemental Table SIII). Fold changes relative to the nitrate- and phosphate-sufficient control are shown. -N; data are from Scheible et al. (2004). -P; Morcuende et al. (2007). Values and colors are in log2 scale.

