
Figure 6. Visuospatial training performance for the steady and unsteady performers.
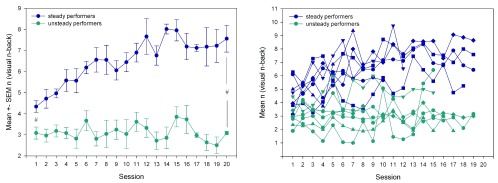
Steady performers: individuals with a significant positive correlation between mean training performance (mean n) per session and the training session. Unsteady performers: no positive correlation. Left: mean ± SEM of n [visuospatial training task (VNB)] over each training session per group. Right: individual mean n (VNB) per training session. Blue: steady performer group. Green: unsteady performer group. # indicates significant performance differences between steady and unsteady performers at the first and the last session (unpaired t-test, p < 0.05).