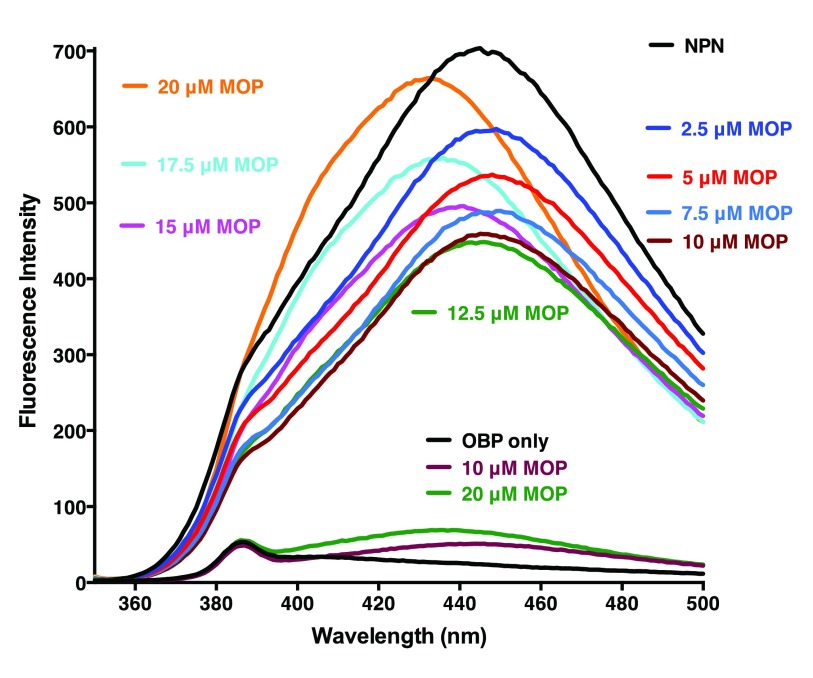
Figure 3. Binding of MOP to AaegOBP1.
Following addition of NPN, fluorescence emission spectra were recorded with increasing doses of MOP. Note the decrease in fluorescence intensity (quenching) as the doses increases up to 10 µM and an increase in fluorescence and blue shift at higher doses. In a separate experiment, included in the lower part of the figure for comparison, fluorescence emission spectra were recorded with AgamOBP1 alone and after addition of MOP, but in the absence of NPN.

