
FIGURE 1.
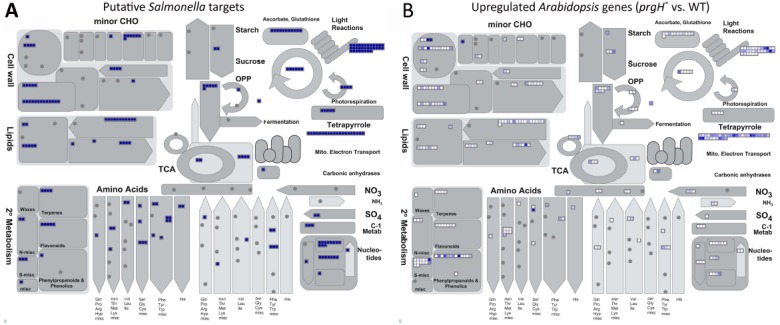
Overview of metabolic processes putatively targeted and known to be repressed by S. Typhimurium effectors. MapMan (Thimm et al., 2004) analysis providing a metabolism overview of (A) predicted Arabidopsis targets of S. Typhimurium effectors predicted with cut-offs of 1 (voting score) and 0.98 (probability aggregated score) by the KMM–SVM model (Kshirsagar et al., 2015) and (B) Arabidopsis genes experimentally identified to be upregulated upon infection with S. Typhimurium prgH– vs. WT (Schikora et al., 2011). Each small square displays a predicted Arabidopsis target of S. Typhimurium (A) or an upregulated Arabidopsis gene (B). In (B), the color intensity visualizes the degree of upregulation.