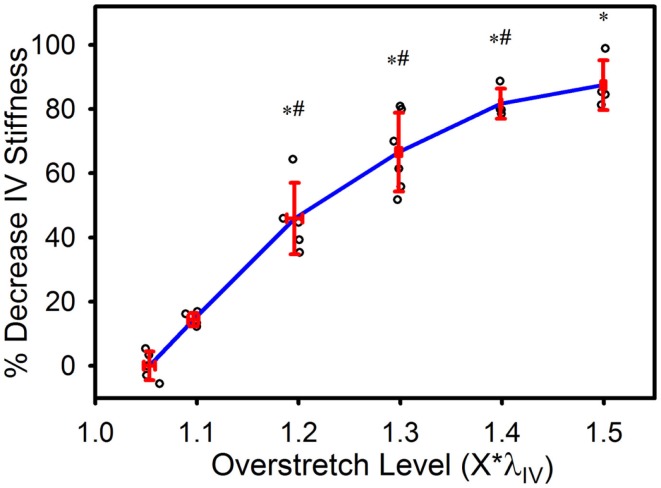
Figure 3.
Percent decrease in axial in vivo stiffness following overstretch. Red error bars indicate SD for each group. Blue line connects group means to clarify trends. (○) indicates individual data points. (*) indicates statistical difference from pre-overstretch values. (#) indicates statistical difference from the group subjected to an overstretch two levels lower.

