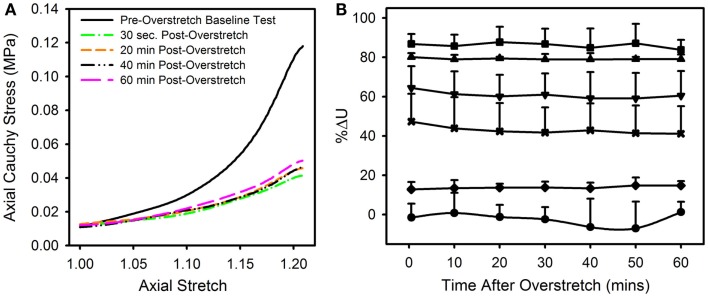
Figure 8.
(A) Data from a representative sample showing the axial stress-stretch curve for the pre-overstretch baseline test, as well as four of the seven post-overstretch baseline tests which were repeated every 10 min for 60 min after overstretch. (B) Means and SD for the various test groups and how these values evolved over time. Note, there was no significant recovery of strain energy following overstretch at any of the tested overstretch levels. [Symbols: (● Control Group, n = 5), (♦ 1.1*λIV Group, n = 5) (x 1.2*λIV Group, n = 5), (▼1.3*λIV Group, n = 6), (▲ 1.4*λIV Group, n = 4), (■ 1.5*λIV Group, n = 4)].

