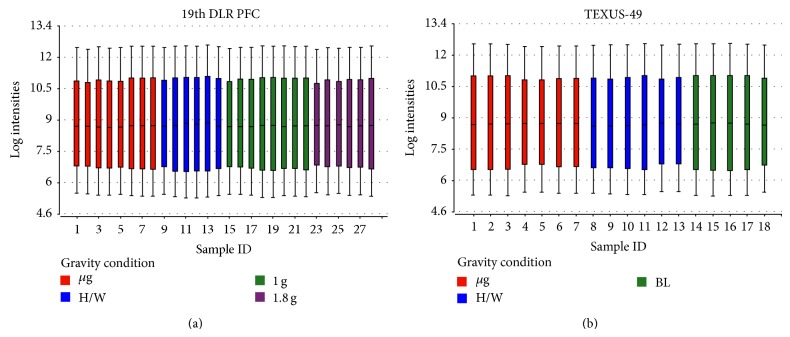
Figure 1.
Boxplots showing the log expression values of individual microarrays. The central line represents the 50th percentile or median, whereas the upper and lower boundaries of the box display the 75th and 25th percentile, respectively. The upper and lower bars represent the 9th and the 91st percentile. Two experimental data sets are displayed, (a) 28 microarrays hybridized with samples from the 19th DLR PFC (8x μg, 6x H/W, 8x 1 g, 6x 1.8 g) and (b) 18 microarrays hybridized with samples originating from the TEXUS-49 campaign (7x μg, 6x H/W, 5x 1 g). The expression data show an even distribution for the displayed log intensities.

