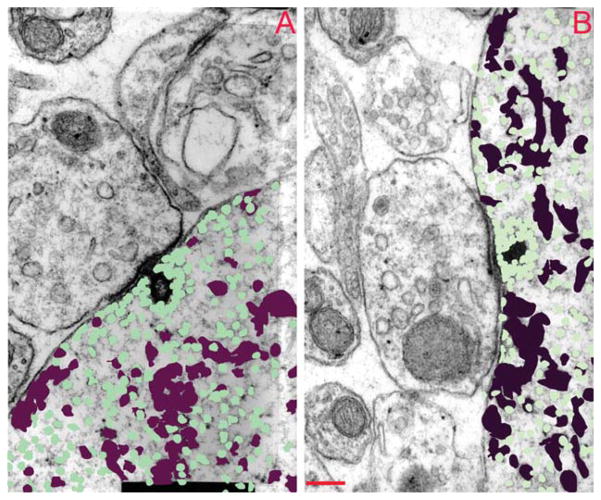
Figure 3.
Spatial distribution of vesicles and cisterns around the ribbon. Sections through a high-SR (A) and a low-SR (B) synapse containing the synaptic ribbon are shown with the cisternal (maroon) and vesicular (green) profiles colorized. Three profiles are superimposed: the section illustrated as well as the prior and subsequent sections in the series. SR, spontaneous rate. Scale bar= 200 nm in B (applies to A, B)

