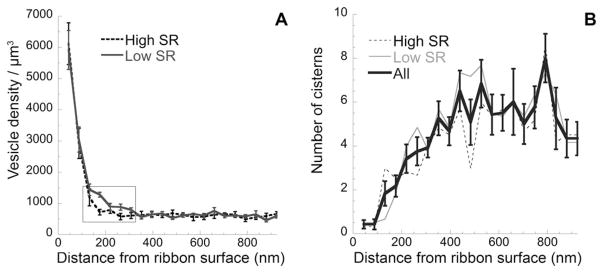
Figure 4.

Distribution of cisterns and vesicles as a function of distance from the ribbon surface. A: Mean vesicle density (± SE) for six high-SR and six low-SR synapses. To calculate density (/μm3), the area of each concentric ring around the ribbon (incremented in 44-μm steps) was multiplied by the section thickness (70 nm). For both panels, only sections including a portion of the ribbon were included. Rectangle indicates the area of significant differences between low- and high-SR synapses. B: Mean cisternal counts (± SE) for all synapses are shown. In addition, counts for low- and high-SR synapses are plotted separately. SE, standard error; SR, spontaneous rate.
