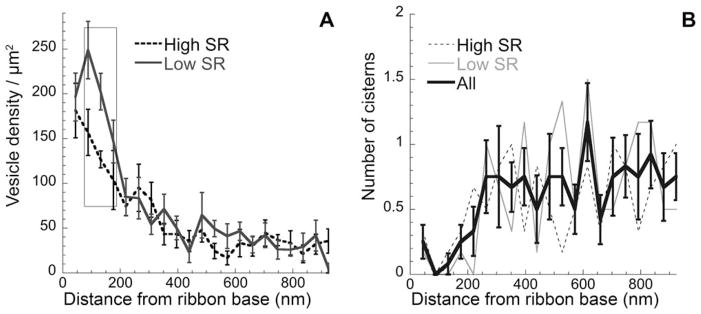
Figure 5.

Distribution of docked vesicles and cisterns. A: Mean density (± SE) of docked vesicles, i.e., within 20 nm of the presynaptic density along the presynaptic membrane. B: Mean number (± SE) of cisterns within 20 nm of the presynaptic density versus distance along the presynaptic membrane is shown for all synapses. In addition, counts for low- and high-SR synapses are plotted separately. Rectangle indicates the area of significant differences between low- and high-SR synapses. SE, standard error; SR, spontaneous rate.
