
Figure 6.
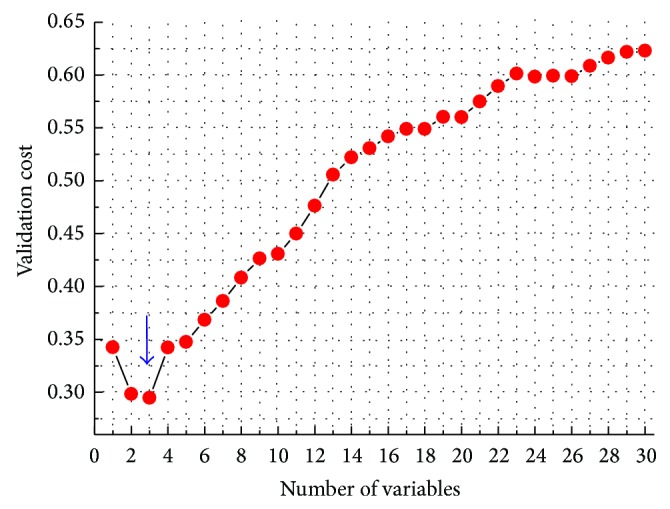
Validation cost (G cost) as a function of the number of variables selected by SPA-LDA algorithm. The arrow indicates the minimum point of the cost curve, which occurs at three wavenumbers.
Official websites use .gov
A
.gov website belongs to an official
government organization in the United States.
Secure .gov websites use HTTPS
A lock (
) or https:// means you've safely
connected to the .gov website. Share sensitive
information only on official, secure websites.
Validation cost (G cost) as a function of the number of variables selected by SPA-LDA algorithm. The arrow indicates the minimum point of the cost curve, which occurs at three wavenumbers.