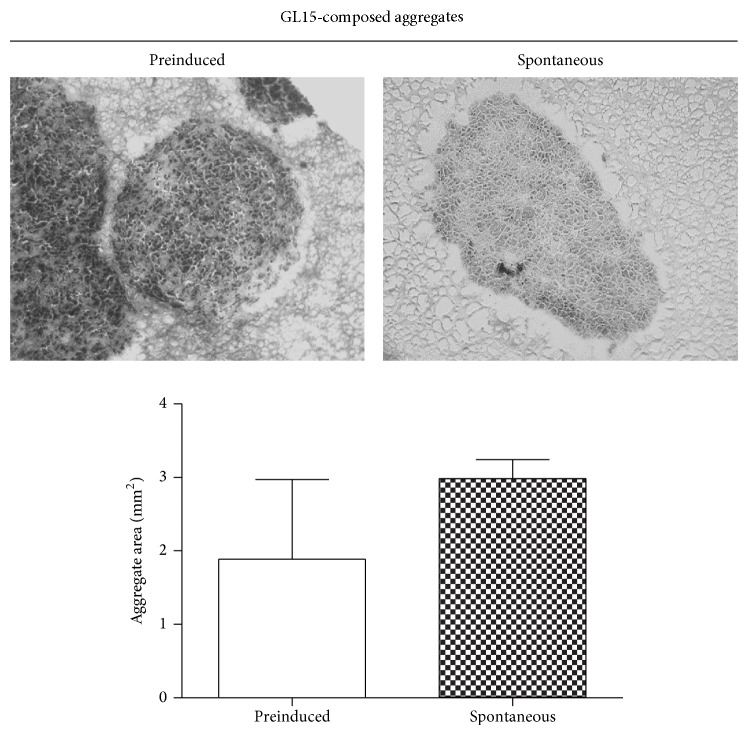
Figure 1.
GL15 cell aggregate morphology. Representative images and quantification of sections from preinduced and spontaneously formed GL15 aggregates (as indicated). Data are means ± SEM. n = 15 for the averaged areas of the aggregate sections, calculated using the ImageJ software (http://imagej.nih.gov/ij/).

