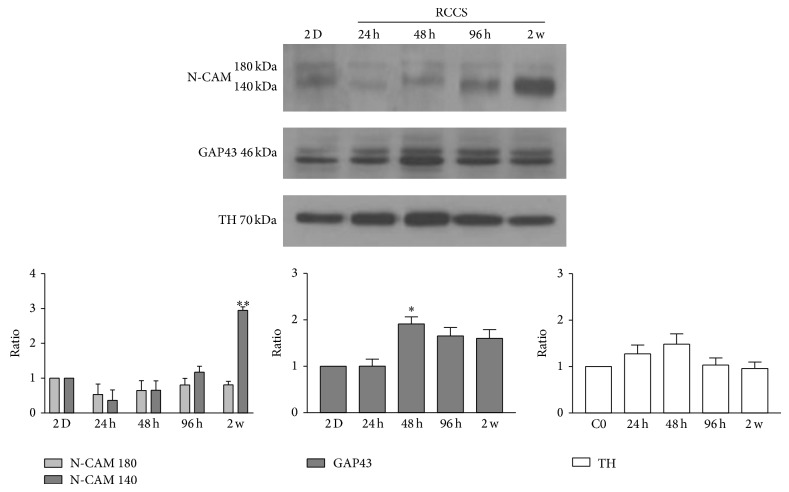
Figure 6.
Expression of neuronal cell markers. Representative Western blotting and quantification of the levels of N-CAM, GAP43, and tyrosine hydroxylase (TH) in SH-SY5Y cells cultured in 2D monolayers and in the RCCS bioreactor for 24 h, 48 h, 96 h, and 2 weeks (2 w). Data are densitometric ratio analyses as means ±SEM from 3 independent experiments. * P < 0.05 and ** P < 0.01 versus 2D monolayers.

