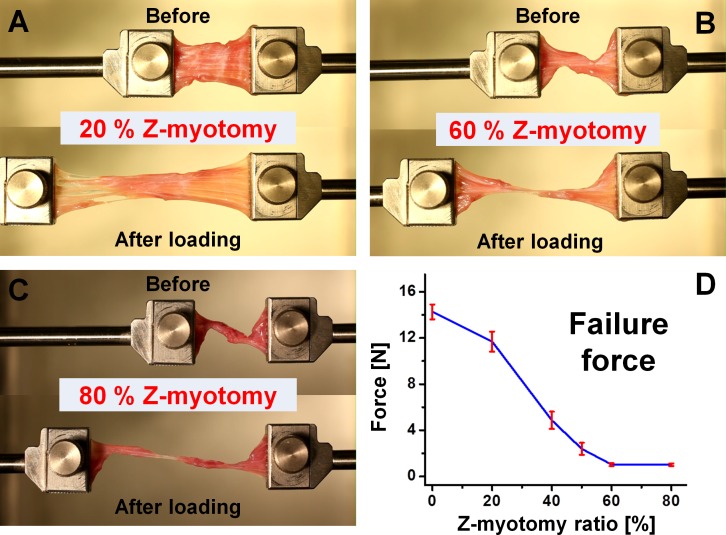
Figure 6.
Tensile testing after Z-myotomy. (A) Twenty percent Z-myotomy before and after elongation. (B) Sixty percent Z-myotomy. (C) Eighty percent Z-myotomy. (D) Failure force transition from 0 to 80% Z-myotomy. Failure force was reduced to minimum by 60% or greater Z-myotomy. Error bars indicate SD.

