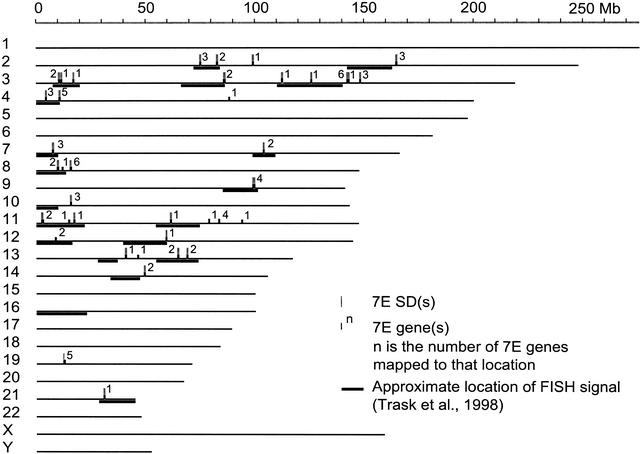
Figure 3.
The 7E SDs (tall gray vertical bars) and 7E genes (short black vertical bars) in the human draft sequence assembly of August 2001 (http://genome.ucsc.edu/) and estimates of positions of cytogenetic bands showing cross-hybridization to 7E SD-containing clones by FISH (black horizontal bars) (Trask et al. 1998). Eighty-five 7E genes and 35 7E SDs are depicted, but because of their proximity to each other, not all sites are independently resolved. SDs are drawn to scale, but genes are not. The three 7E genes from BACs not included in the August 2001 assembly are not depicted in this figure. The number of 7E genes in each SD is indicated. The correlation between the UCSC map and the FISH results is imperfect, because FISH signals are mapped only with the precision of a chromosome band (∼6 Mb), and band boundaries are only approximately defined in the draft sequence (BAC Consortium 2001; Kent et al. 2002).

