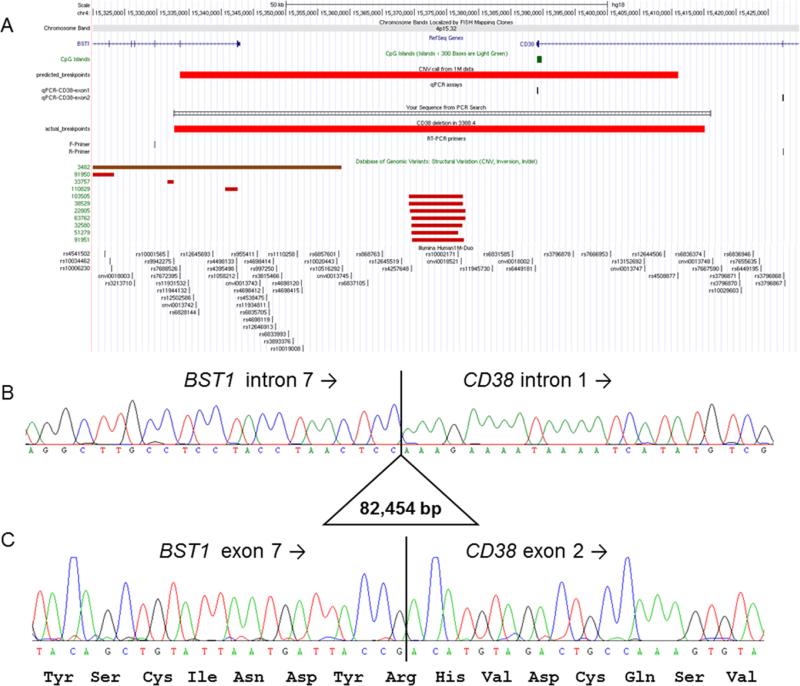
Figure 2.
Molecular characterization of CD38 deletion. (A) Figure from UCSC genome browser showing the position of BST1 and CD38, predicted deletion breakpoints based on 1 M SNP data, position of qPCR assays used to validate the deletion, and position of long-range PCR primers used to determine the true breakpoint positions. There are no similar CNV listed in the Database of Genomic Variants v10 (February 2011). Region shown is chr4:15 320 000–15 430 000 (NCBI36/hg18 build). (B) Sanger sequencing of the long-range PCR product from the BST1-F primer spanned the deletion breakpoints and shows the true deletion coordinates to be chr4:15 332 700– 15 415 153 (NCBI36/hg19). TCC microhomology was seen at each end of the deleted region. (C) Sequencing of a 201 bp RT-PCR product confirmed that the reading frame of the fusion transcript was maintained. Similar results were obtained using a second set of primers.

