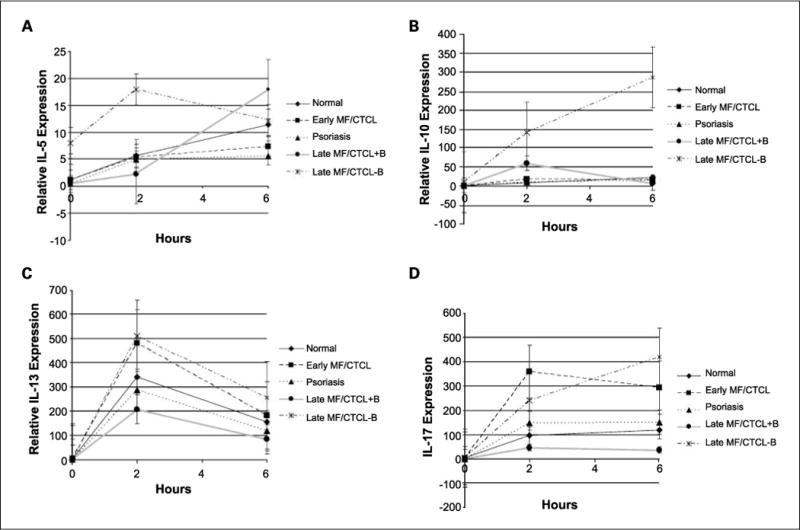
Fig. 3.

Cytokine gene expression among activated PBMCs from early and late MF/CTCL+B and MF/CTCL−B patients compared with normal and psoriasis patients. A–D, quantitative RT-PCR was performed on PBMCs from normal (n = 8), psoriasis (n = 4), early MF/CTCL (n = 8), and late MF/CTCL+B (n = 4) and late MF/CTCL−B (n = 3) patients that were stimulated for the indicated time and analyzed for IL-5 (A), IL-10 (B), IL-13 (C), and IL-17 (D) gene expression. The relative level of cytokine gene expression was normalized to β2M level of gene expression and plotted to the unstimulated level of gene expression for normal PBMCs for IL-5, IL-10, IL-13, and IL-17. Points, mean; bars, SE. Data points that included values that were computed from linear regression analysis are denoted with smaller markers.
