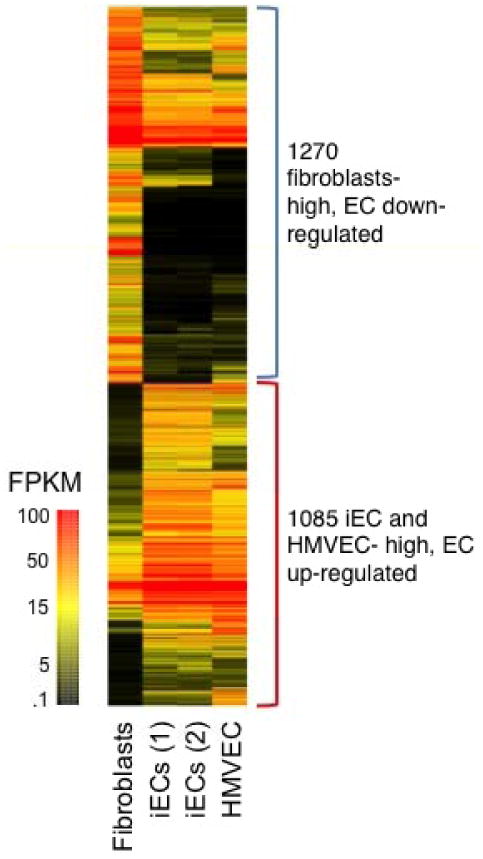
Figure 3.

Transcriptional profiling of iECs. Heat map of genes differentially expressed in iECs and HMVEC versus fibroblasts. The selection criteria for gene transcripts shown in the heat map were either 1.) those genes that were expressed at a level >3 FPKM in HMVECS and at least two-fold greater expression than in fibroblasts; or 2.) those genes that were expressed at a level >3 FPKM in fibroblasts and at least two-fold greater expression than in HMVECs as selected from the initially filtered list of ENSEMBL-modeled genes with FPKM >3 (13,181 transcripts), and that exhibited Benjamini-Hochberg adjusted p<0.05 in a Welch ANOVA testing fibroblasts versus iEC versus HMVEC (740 expected, Welch: 3,459 observed, Students: 7466 observed). The pool of 2× differential genes were hierarchically clustered with equal weighting of both absolute and differential expression levels and colored as shown based on absolute FPKM expression levels as calculated via the Topphat Cufflinks pipeline using ENSEMBL Gencode locus definitions.
