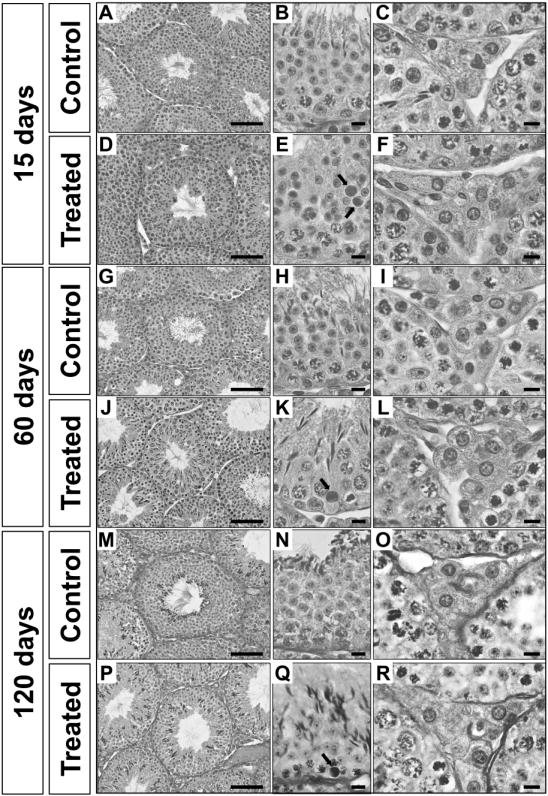
Figure 5.

Light microscopy images of testis sections from control and treated mice at the indicated time points. Treated mice received five doses of nanoparticles (1 mg/kg/dose) and were sacrificed 15 (Panels D, E and F), 60 (Panels J, K and L) and 120 (Panels P, Q and R) days after the first injection. As illustrated in the higher magnification panels (Panels E and K), tubular cross-sections of seminiferous epithelium show that treated mice present a significant increase in germ cell apoptosis. Regarding the Leydig cell morphology, as depicted in the higher magnification panels, treated mice (Panels F, L and R) present higher Leydig cell volume when compared to control mice (Panels C, I and O). Scale bars from panels A, D, G, J, M and P represent 100 μm and scale bars from panels B, C, E, F, H, I, K, L, N, O, Q, R represent 10 μm. Arrows (Panels E and K) are indicating apoptotic cells.
