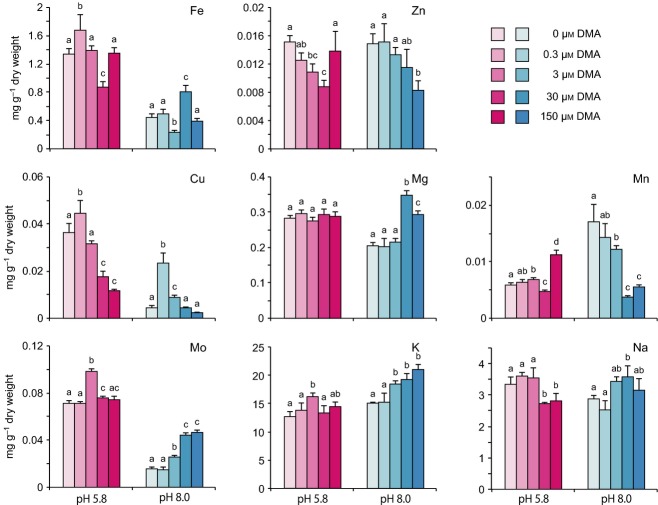
Figure 3.
Concentrations of various metals in rice root tissues. Experiment was conducted as described in the legend to Figure 2. a,b,cDifferent letters in the same group of bars indicate significant difference (P < 0.05). Values shown are mean ± standard deviation (SD) (n = 5).

