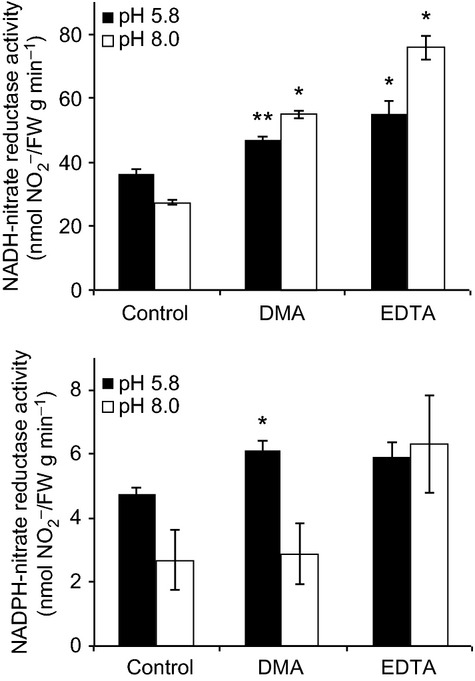
Figure 6.

Enzyme activity of NADH- and NADPH-dependent nitrate reductases. Enzyme activities were determined in shoots of seedlings in different treatments. DMA or EDTA was added to medium to a final concentration of 30 μm, no chelators were added to control. Assays were performed separately to measure NADH- and NADPH-dependent NR activities. Asterisks indicate significant difference to control (no DMA) under each pH (*P < 0.05; **P < 0.01; Student's t-test). Values shown are mean ± standard deviation (SD) (n = 3).
