
Figure 4.
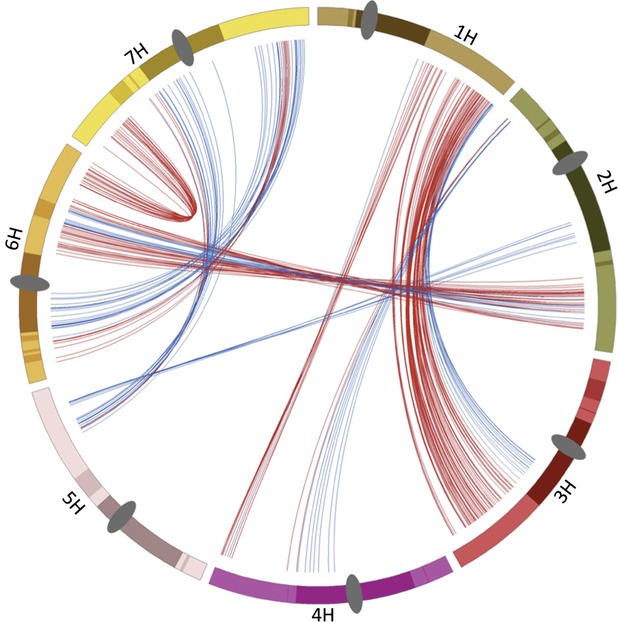
Barley ohnolog pairs and the LR-PC region.
Barley chromosomes 1H–7H are indicated by different coloured bars, LR-PCH regions are indicated by dark shading, flanking LR by light shading and centromeres by dark grey ovals. All features are scaled by pseudo-physical map position (IBGSC, 2012). Ohnolog gene pairs are connected by colour-coded lines to indicate HR–HR pairs (red) and LR–HR pairs (blue). There are no LR–LR pairs.