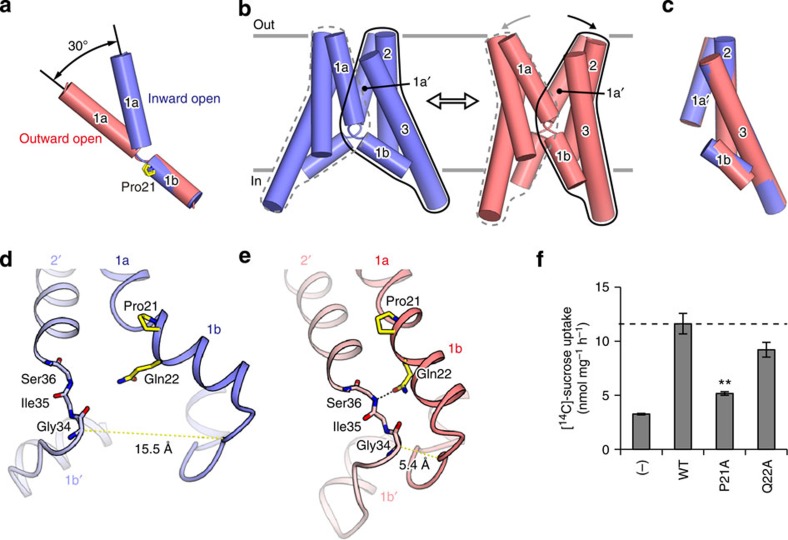
Figure 3. Conformational change of EcSemiSWEET.
(a) Superimposition of TM1 between the two conformations. The inward-open and outward-open conformations are coloured blue and pink, respectively. The Pro21 residue is shown as a stick model. (b) Structural comparison of the overall structures between the two conformations, coloured as in a. The structural unit consisting of TM1b, TM2, TM3 and TM1a’ (from the adjacent protomer) is enclosed by black lines, with its counterpart enclosed by grey dotted lines. The relative rotation of the structural units is illustrated by the arrows on the top of the outward-open dimer. (c) Superimposition of the structural units between the two states, coloured as in a. (d,e) Close-up views of the PQ-loop motif in the inward-open (d) and outward-open (e) conformations, coloured as in a. The hydrogen bond is depicted as a black dotted line. The distance between the Gln22 side chain and the Gly34 main chain in the outward-open conformation is 4.9 Å. (f) Sucrose uptake by SemiSWEET mutants in the liposome assay (mean±s.e.m., n=3). A significant difference from the wild-type value (WT) is indicated by asterisks (**P<0.01, Student’s t-test).

