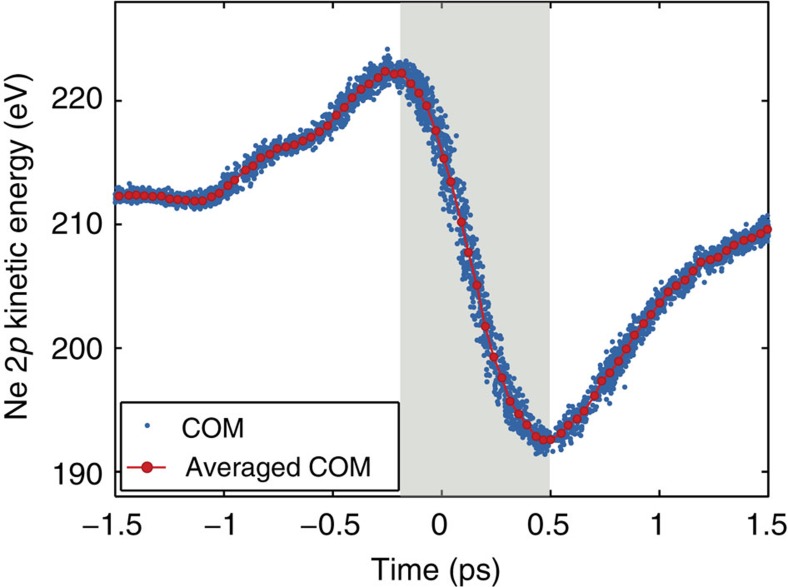
Figure 10. Streaking map.
The centre-of-mass (COM) of the Ne 2p photoelectron peak is shifted in kinetic energy depending on the temporal overlap of the ionizing FEL pulse and the streaking THz pulse. As the sources are closely synchronized, the shift in kinetic energy as a function of temporal overlap can be accurately mapped by averaging the shift over several single-shot measurements as the relative delay is scanned. Interpolating the averaged, shifted COM at each delay results in a continuous curve that can be used to map the exact arrival time of any streaked photoelectron spectrum generated by an FEL pulse that arrives within the ~720-fs, single-valued streaking ramp (indicated by the shaded region in the plot).

