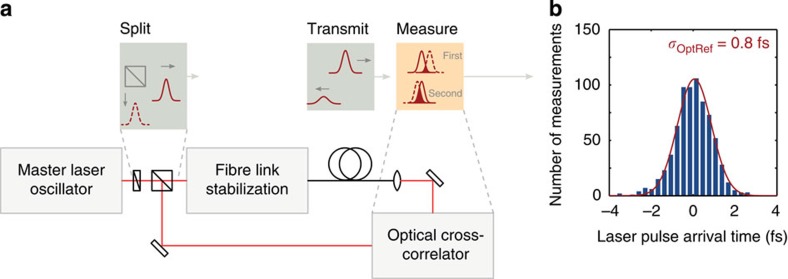
Figure 8. Fibre link characterization.
The distribution of relative arrival time is compiled from measurements between laser pulses extracted from the fibre link and pulses directly from the master laser oscillator, which were made with an independent out-of-loop optical cross-correlator, as shown in a. Each measurement gives the average temporal overlap over an interval of 2 ms and measurements were made every 5 s for 1 h. Over this period, a residual timing jitter of 0.8 fs r.m.s. was observed, determined from the Gaussian fit to the corresponding distribution shown in b.

