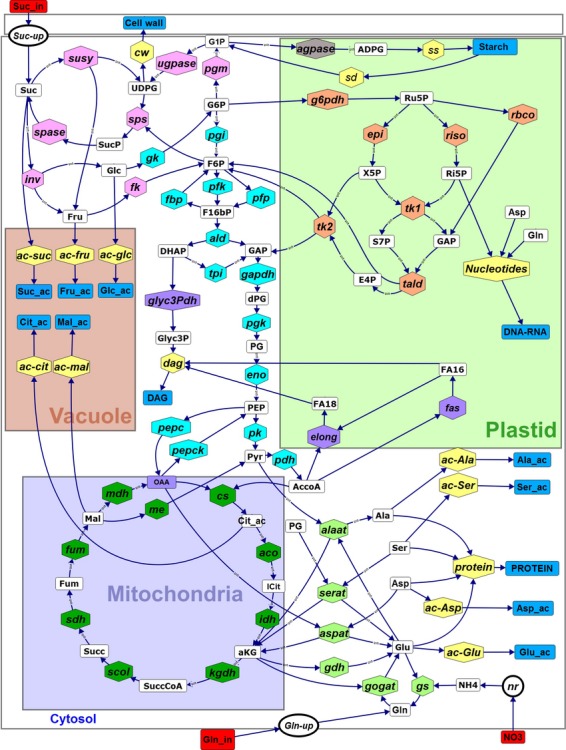
Figure 1.

The metabolic network of tomato cells. The system is a cell with symbolic subcellular compartments. Each colour indicates a pathway: green for the TCA cycle; blue for glycolysis; orange for the pentose phosphate pathway; pink for sucrose and starch synthesis; and yellow for the fluxes towards external metabolites, which are in presented in blue boxes. Imported metabolites are in red boxes. The compartmentation indicated in the figure is reminiscent of the physiological situation, and for the sake of clarity co–factors were omitted. Irreversible reactions are indicated by unidirectional arrows. The illustration was designed with omix (Droste et al., 2011).
