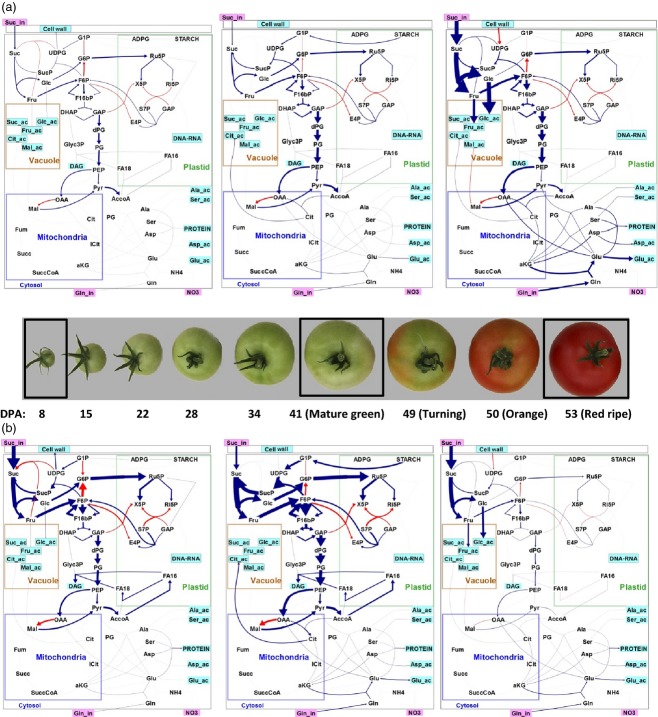
Figure 4.
Flux maps at three stages of tomato fruit development. Metabolic fluxes during tomato fruit development with (a) fluxes expressed in mmol fruit−1 day−1, with a log-scale representation, and (b) normalized fluxes by the total carbon metabolized. Illustration designed with omix (Droste et al., 2011).

