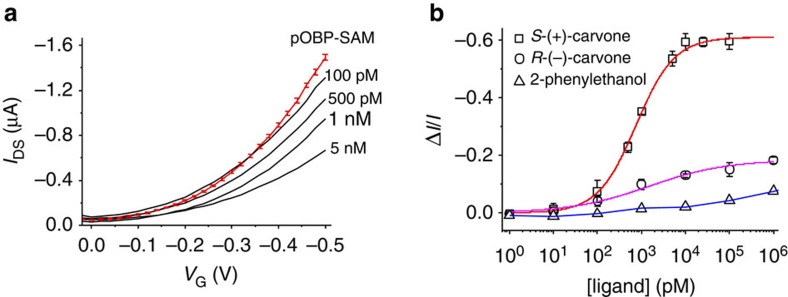
Figure 5. Electronic chiral differential detection of odorant molecules.
In a, the device IDS versus VG transfer characteristics are reported both for a pristine pOBP-SAM gate (red curve) and for a gate exposed to concentrations of (S)-(+)-carvone in the 100 pM—5 nM range (black curves). These curves were measured after the device stabilization had been performed and an average relative error of 5% is measured for the base-line curve. In b, the binding curves gathering the ΔI/I data points measured with a WGOFET whose pOBP-SAM gate is exposed to the (R)-(−)- and (S)-(+)-carvone as well as the 2-phenylethanol ligands, in the 1 to 106 pM range, are reported. The data are plotted as the ΔI/I average values measured on three different devices for each curve.

