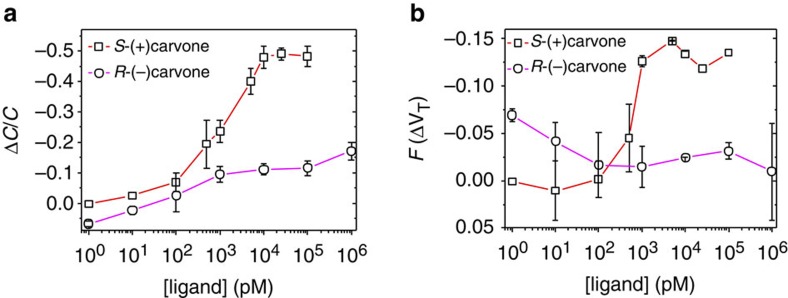
Figure 8. Capacitance and threshold voltage contribution to current fractional changes.
In a, the fractional changes of the capacitance, and in b, the F(ΔVT) term data as extracted from the source–drain current measured on exposure to the (R)-(−)- and (S)-(+)-carvone ligands in the 1 to 106 pM range.

