
Figure 4. Scatter plot displaying the relationship between centiMorgan distances (left Y-axis) and physical distances (X-axis, Mb) along the 11 chromosomes of P. vulgaris L.
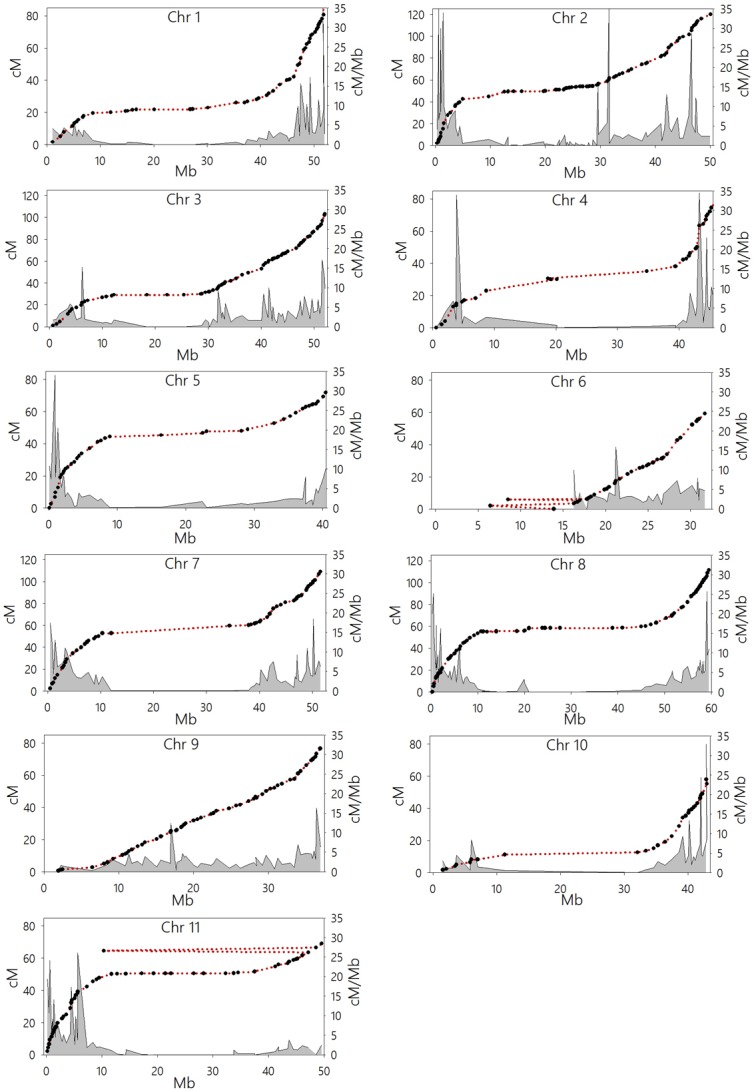
Black circles represent mapped markers (513+739). Red dotted line connects neighboring markers for visual ease. First order differential plot (grey density plot) represent cross-over rate across a given chromosome (right Y-axis, cM/Mb).