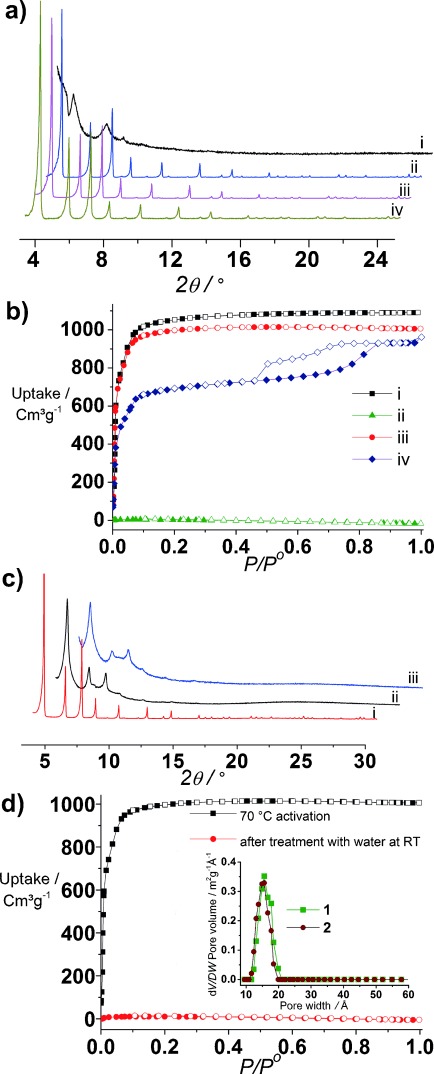
Figure 2.

Evaluation of the chemical and structural stability of activated single linker phases by PXRD and N2 isotherm measurement. a) PXRD patterns of 1 after i) activation at 70 °C, ii) activation with SCO2, iii) treatment with water at RT followed by activation with SCO2, and iv) treatment with water at 120 °C followed by activation with SCO2. b) N2 isotherms of 1 at 77 K after i) activation with SCO2, ii) activation at 70 °C, iii) treatment with water at RT followed by activation with SCO2, and iv) treatment with water at 120 °C followed by activation with SCO2. c) PXRD patterns of 2 after i) activation at 70 °C; ii) treatment with water at RT followed by activation with SCO2, and iii) treatment with water at 120 °C followed by activation with SCO2. d) N2 isotherms of 2 at 77 K after different treatments; the inset shows the DFT pore size distribution curves of 1 and 2.
