Figure 3.

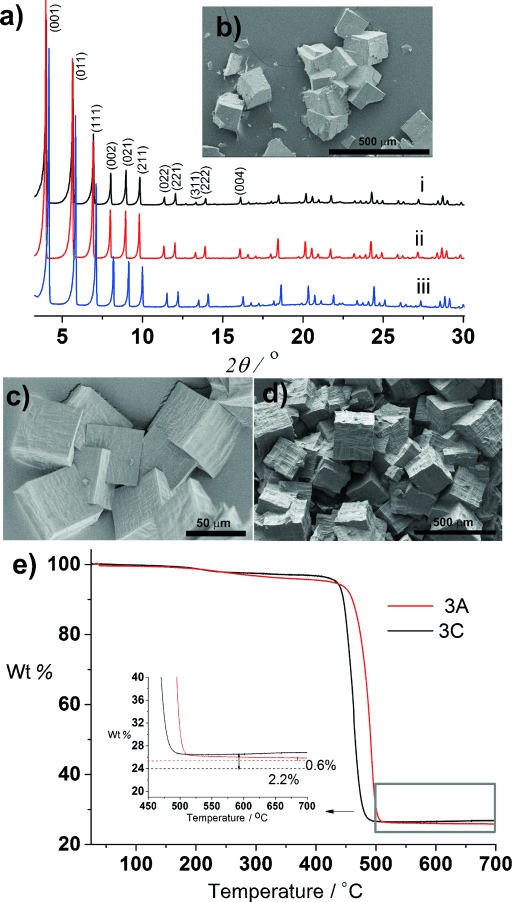
Structure and phase purity of mixed linker phases. a) PXRD patterns of as-made i) 3 A, ii) 3 B, iii) 3 C. b)–d) SEM images of as-made 3 A, 3 B, and 3 C, respectively. e) TGA profiles of 3 A and 3 C on heating in air. Inset: the final ZrO2 mass expected for the stoichiometric Zr/linker ratio of two, as shown by dotted lines (red: 3 A, black: 3 C). In contrast to 3 A, the difference of 2.2 % between calculated and observed residual ZrO2 confirms the presence of about 8 % missing linker defects in 3 C, which is further confirmed by CHN data.
