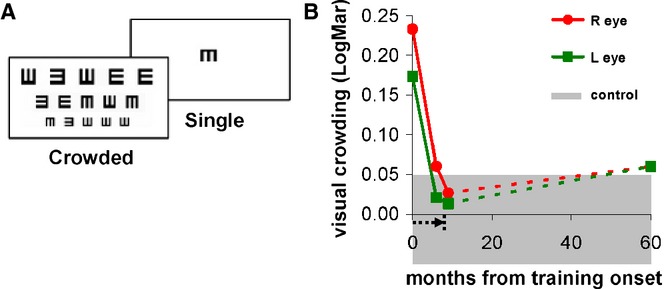
Figure 2.

Visual crowding improvements during and following training. (A) Stimuli examples for measuring crowding effects and visual acuity by the ‘Tumbling-E patterns test’ (Bonneh et al., 2004), which is a LogMAR chart equivalent. The minimal size for central pattern identification is measured under single (on left) and multiple (crowded, on right) pattern conditions to determine visual acuity; crowding effects are estimated from the acuity difference between the crowded and single conditions, smaller crowding effects indicate better vision. The x-axis shows the time since the onset of training (arrow below the x-axis indicates the duration of the training), and the y-axis denotes the crowding effects in LogMAR units. Visual crowding was measured pre-training (at x-axis = 0), during and at the end of the training (x-axis = 9), and more than 4 years post-training (x = 60 months). The red and green indicate right (R) and left (L) eyes, respectively. The gray shaded zone denotes normal crowding effects of the normal adult population (0 ± 0.05 (SEM)).
