
Figure 2.
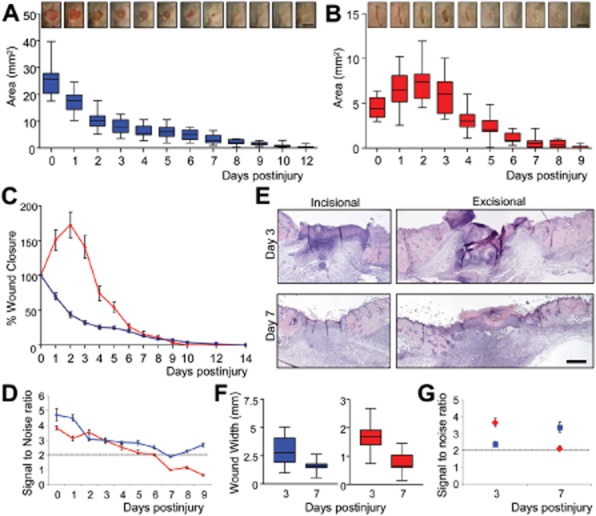
Planimetric wound closure is more reproducible in excisional wounds. Planimetric time course reveals differing temporal healing profiles for excisional and incisional wounds. Box and whisker plots map the changes in total wound size over time for excisional (A) and incisional (B) wound closure. Between wound divergence of healing profile is emphasized when data are expressed as percentage wound closure (C); with signal to noise ratio (D) indicating excisional wounds are more stable over time. (E) Histological analysis of excisional and incisional wounds at two distinct time points (day 3 and 7) illustrates the reduction in wound width over time for both wounds (F) mirroring planimetry. However, by histology, incisional wounds have a greater signal to noise ratio at day 3, while this is reversed at day 7 (G). Bootstrapping was performed to estimate S/N variability. Blue lines/squares, excisional data; Red lines/diamonds, incisional data. Data shown as mean ± SEM (C) or ± SD (D, G) (n = 15–16). Bar = 5 mm (A and B) and 500 μm (E).