Figure 5.

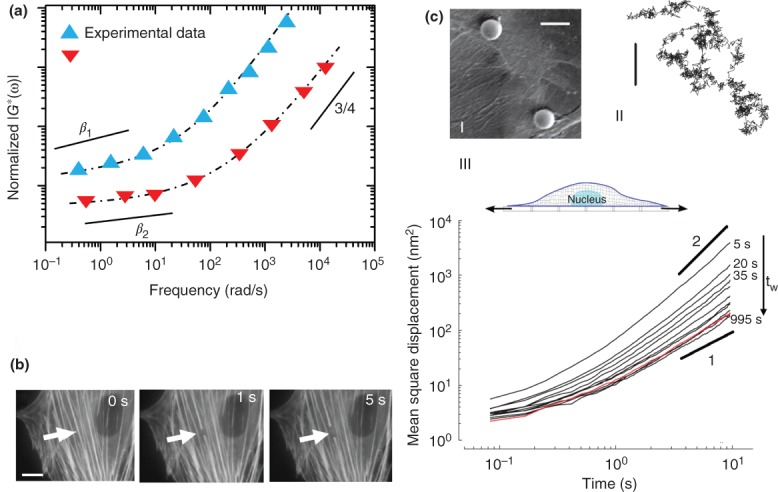
Cell universal behaviors. (a) The frequency response of cells measured with several mechanical measurement techniques (such as AFM, PTM, and magnetic twisting cytometry) collapses into two master curves after rescaling the experimental data from different rheological measurements (see Ref 33 for details). The frequency dependent dynamic modulus follow two distinct regimes in these master curves that can be fitted by a power law function: |G * (ω)| : ∼ωβ, where ω is frequency and β is power law exponent. At high frequencies both curves show β = 3/4 but at low frequencies they exhibit lower range of power-law exponents, β1 ∼ 0.25 and β2 ∼ 0.15 (see Ref 33 for further details). (b) Spontaneous retraction of a single actin stress fiber upon severing with a laser nanoscissor shows existence of prestress in the cytosketal bundles. Scale bar = 2 µm. (Reprinted with permission from Ref 34. Copyright 2006 Cell Press.) (c) Anomalous diffusion and response of the cell to stretch. (c-I, II) Spontaneous movements of beads attached firmly to the cell show intermittent dynamics. Scale bars = 10 µm. (Reprinted with permission from Ref 13. Copyright 2005 Nature Publishing Group.) (c-III) The mean square displacement (MSD) of a bead anchored to the cytoskeleton exhibits anomalous diffusion dynamics < r2 > ∼ tα (subdiffusive α < 1 at short time intervals and superdiffusive α > 1 at longer time intervals). Red curve indicates the MSD of the bead for a non-stretched cell and other curves show the MSD of the bead in response to a global stretch measured at different waiting times (tω) after stretch cessation. (Reprinted with permission from Ref 35. Copyright 2007 Nature Publishing Group.)
