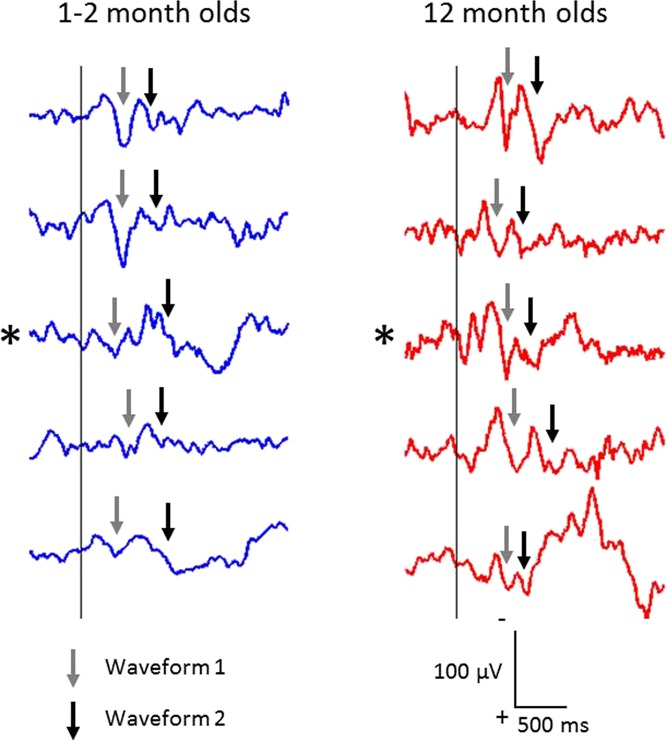
Figure 2.

Single-trial electroencephalography responses to inoculation, recorded from Cz, after the first contact with the inoculation needle (at time 0; vertical line) in the 12-month-olds (right) and, for comparison, 5 of the clearest responses in the 1- to 2-month group (left). Note the striking reproducibility in the older group. Traces marked with an asterisk belong to a single infant that was studied longitudinally at both ages. Traces are shown without alignment to either the first or second waveforms. Arrows point to the first (gray arrows) and second (black arrows) waveforms that were identified in individual trials after alignment (see Figures 3 and 4 for aligned group average responses).
