
Figure 6.
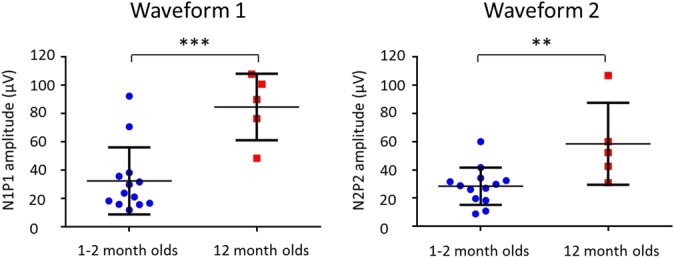
Column scatterplots showing the peak-to-peak amplitudes of the first (left) and second (right) waveforms for 1- to 2-month-olds (blue; n = 13) and 12-month-olds (red; n = 5). For both waveforms, 1- to 2-month-olds had lower peak-to-peak amplitudes than 12-month-olds. The mean (solid horizontal line) and SD (whiskers extending from the mean) are indicated. **P < 0.01; ***P < 0.005.