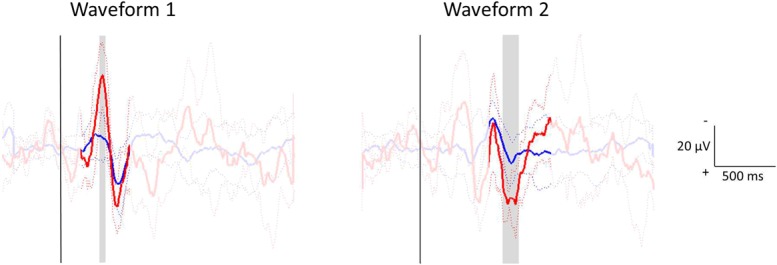
Figure 7.

Statistical comparison of the electroencephalography traces of 1- to 2-month-olds (blue) and 12-month-olds (red) for the first (left) and second (right) waveforms. For each waveform, traces were aligned between groups (without affecting within-group alignment). Independent samples t tests assessed whether the distribution of amplitudes at each time point in a region of interest centered on the waveform (150-600 milliseconds for the first waveform; 550-1100 milliseconds for the second waveform) differed between the 2 groups. The aligned group averages (±SD) are shown, with statistically significant differences highlighted in gray.
