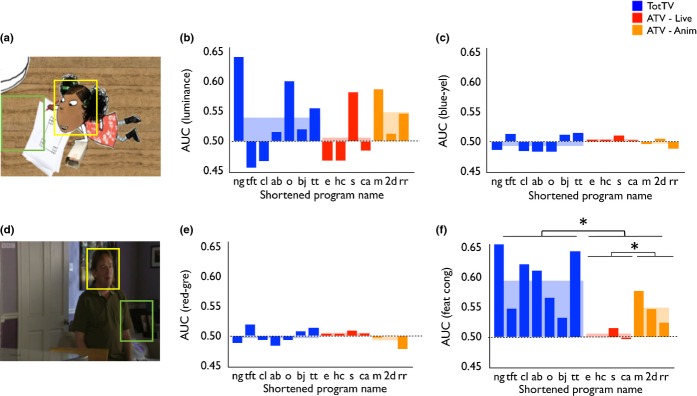
Figure 5.

(a) and (d) show sample frames illustrating our ROC analyses. For each frame, the face of the speaking character was identified via hand-coding (marked yellow) and a randomly positioned baseline was generated with the same dimensions (marked green). Higher AUC values indicate that a particular feature dimension was more present in the speaking character face than in the baseline samples, across all the frames that were analysed. (b) AUC for luminance; (c) AUC for blue–yellow intensity; (e) AUC for red–green intensity; (f) AUC for feature congestion. *p < .05.
