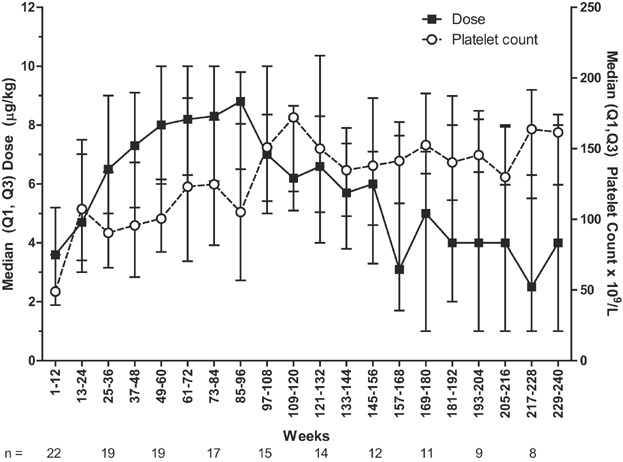
Fig. 2.

Median (Q1, Q3) average weekly romiplostim dose (left y-axis) and median (Q1, Q3) platelet counts (right y-axis) are presented over time by 12-week intervals with the number of patients with available data underneath the x-axis.

Median (Q1, Q3) average weekly romiplostim dose (left y-axis) and median (Q1, Q3) platelet counts (right y-axis) are presented over time by 12-week intervals with the number of patients with available data underneath the x-axis.