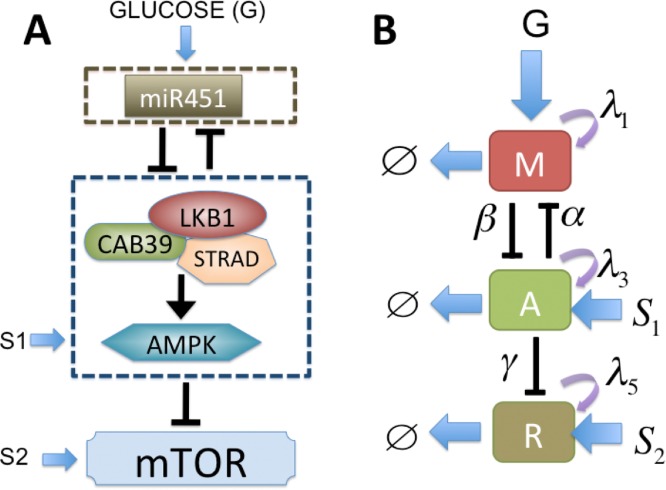
Figure 3. A simplified model of the network shown in Fig. 1.
(A) Conceptual model of regulation of miR451, AMPK complex, and mTOR in GBM cell migration and proliferation [6]. (B) Cartoon model (extended from [41]): miR-451 level and activity of its target complex (CAB39/LKB1/AMPK), and mTOR levels were represented by ‘M’, ‘A’, and ‘R’, respectively.

