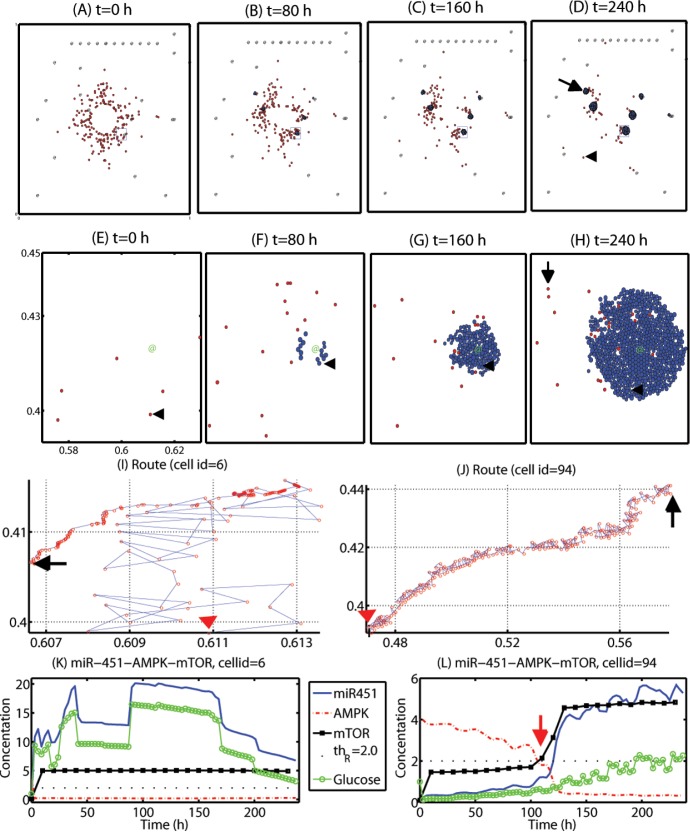
Figure 5. Dynamics of cell migration and proliferation in the hybrid model.
Some diffusely infiltrating glioma cells in the -phase are attracted to the glucose-rich BV sites and switch to the -phase for fast growth in the favorable microenvironment while others are still moving around in the heterogeneous environment. (A-D) Tumor growth/invasion patterns in the computational domain Ω = [0, 1]2 at t = 0, 80, 160, 240 h after surgery. Arrowhead = migratory cell, arrow = growing cells near a BV. @ = BV. (E-H) Profiles of tumor cells in a small region [0.57, 0.63] × [0.39, 0.45] (blue solid box in (A-D)) of the domain. Arrowhead = 6th cell, arrow = 94th cell. @ = BV. (I, J) Migration routes of two cells (cellid = 6 in (I), 94 in (J)). Red arrowhead = initial position, Black arrow = final position at t = 240 h. (K, L) Concentrations of miR-451 (blue solid line), AMPK complex (red dotted line), mTOR (black circle), and glucose level at the cell site of two cells considered in (I, J). Threshold value of mTOR (Th R = 2.0) was represented in black dots. Legends in (L) is same as one in (K).

