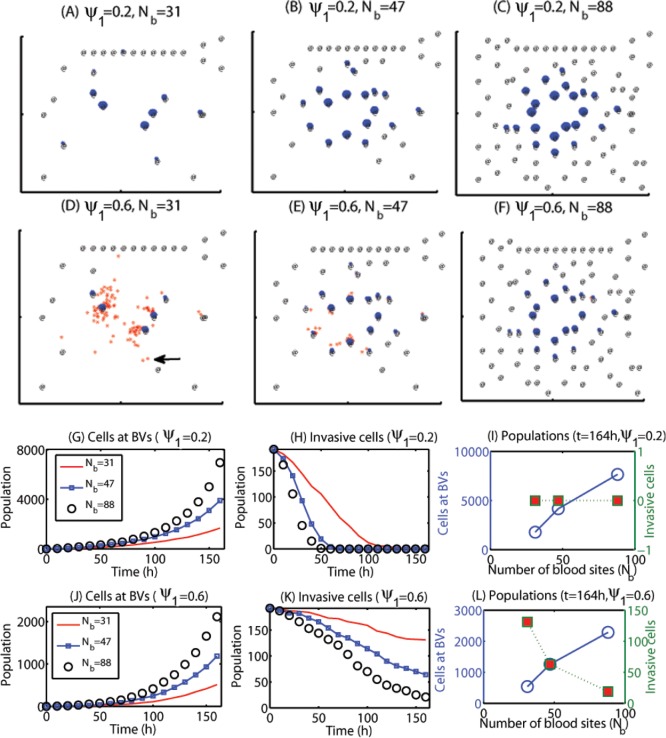
Figure 6. Effect of random motility and blood density on regulation of migration patterns.
The tumor population is increased regardless of the relative ratio of the random motility (ψ 1) as the number of blood vessels (N b) is increased because more invasive cells settle down near BVs, leading to faster tumor growth. On the other hand, fewer infiltrative cells switch to the growth phase for the relatively low BV density in the case of greater cell motility, reducing overall tumor growth but increasing further infiltration potential. (A-C) Spatial patterns of migratory cells (red dots) and growing cells near BVs (blue dots) at t = 164 h for a low (ψ 1 = 0.2) random motility in the presence of various densities of blood vessels (N b = 31, 47, 88) in the brain tissue after surgery. @ = BV sites. (D-F) Same as (A-C) but for an intermediate level of random motility (ψ 1 = 0.6). (G-I) Time courses of populations of growing cells at BVs (G) and invasive cells distant from BVs (H) for three cases in (A-C) with the low (ψ 1 = 0.2) random motility: (N b = 31 (red solid line), 47 (blue square), 88 (black circle)). Populations of proliferative (blue empty circles) and invasive (red filled squares) tumor cells at final time t = 164 h for various N b (N b = 31, 47, 88) are shown in (I). (J-L) Same as (G-I) but for an intermediate level of random motility (ψ 1 = 0.6). The legend is same as one in (G-I).

