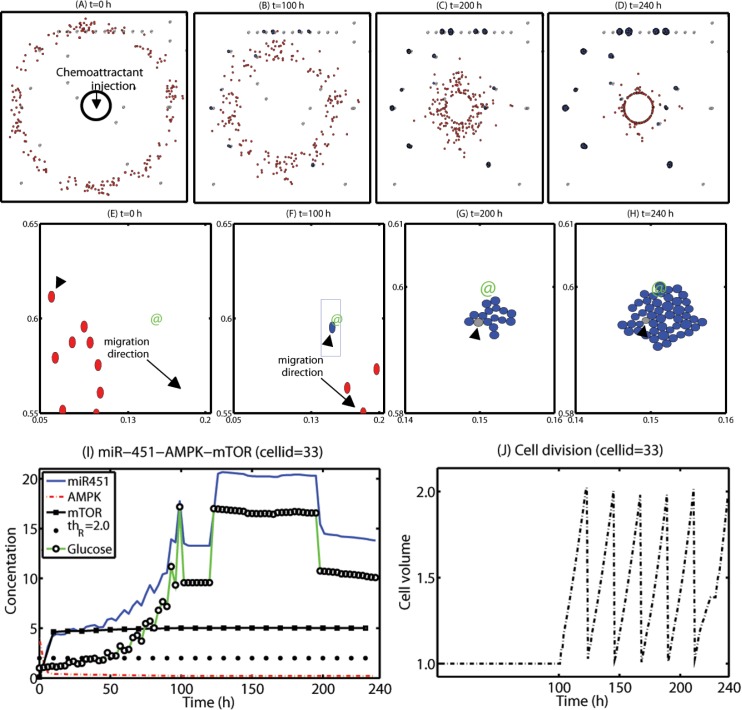
Figure 8. A proposed localization strategy of eradicating invisible migratory cells after first surgery.
Some infiltrative glioma cells move back to the periphery of the resection site for the second surgery in response to the injected chemoattractant at the resection site after conventional surgery. However, some growing cells near BVs remain near BVs and do not respond to the chemotactic forces, reducing the efficacy of the localization strategy. (A-D) Spatial profile of cancerous cells at t = 0 (A), 100 (B), 200 (C), 240 (D) h after surgical resection at t = 0h followed by an injection of a chemoattractant at the resection site. The visibly detectable tumor core was surgically removed at t = 0 h (black solid circle in (A)). The localized invasive (red circles) glioma cells form a mass of tumor in (D) for a possible secondary surgery after 10 days, leading to eradication of invisible migratory cells. However, some of the cells (blue circles) attracted to BVs can still grow. Domain size = [0, 1]2. (E-H) Spatial profiles of a subset of migratory cells. Red circles = migratory cells, blue circles = growing cells, @ = BV. (I-J) A time course of miR-451-AMPK-mTOR (I) and cell volume in a growing glioma cell (arrowheads in (E-H); cellid = 33) near a BV in response to high glucose from the BV.

