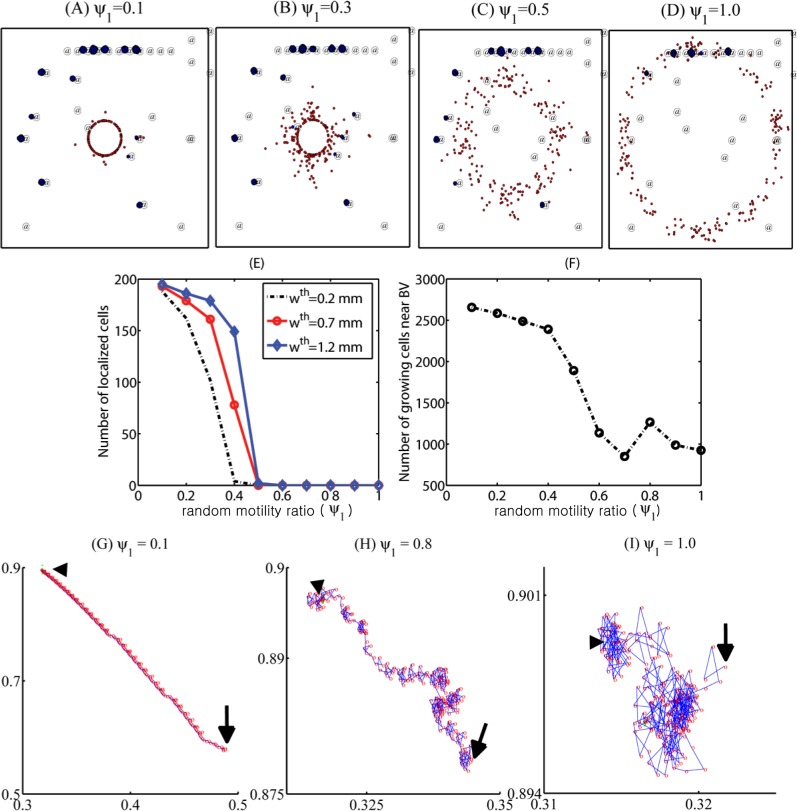
Figure 10. Effect of random motion on the efficacy of localization strategies.
(A-D) Patterns of cell migration under the localization strategy with various random motility rates: ψ 1 = 0.1 (A), 0.3 (B), 0.5 (C), 1.0 (D). (E) Population of localized invasive cells at day 10 within a narrow strip (Ωp) on the periphery of the resected area (Ωs) from the first surgery in the whole domain (Ω). Ωp = {P = (x, y) : dist(P, Ωs) < w th} where w th = 0.2, 0.7, 1.2 mm. (F) Population of proliferative cells at BV sites after chemoattractant injection as in (E) at final time (t = 10 days). (G-I) Trajectories of migratory cells in the brain tissue when ψ 1 = 0.1 (G), 0.8 (H), 1.0 (I). Arrowhead = initial position, arrow = end position. As random motility ψ 1 is increased, the relative chemotaxis strength is decreased and infiltrative glioma cells do not respond to the chemoattractant signals, reducing the treatment efficacy of localization strategies.

