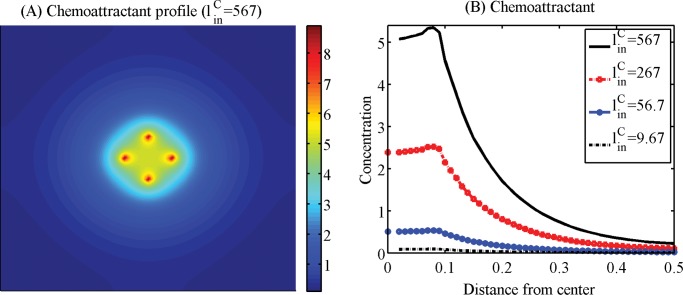
Figure 13. Spatial profiles of the chemoattractants near the surgical site.
(A) Spatial profile of the chemoattractant at a high injection rate () in Fig. 12A. (B) Concentrations of the chemoattractant in the radial direction for four different injection rates (, 267, 56.7, 9.67) in Figs. 12A–D. Relatively strong chemoattractant injections are necessary in order to create a sufficient gradient of chemoattractants to attract infiltrative glioma cells.

