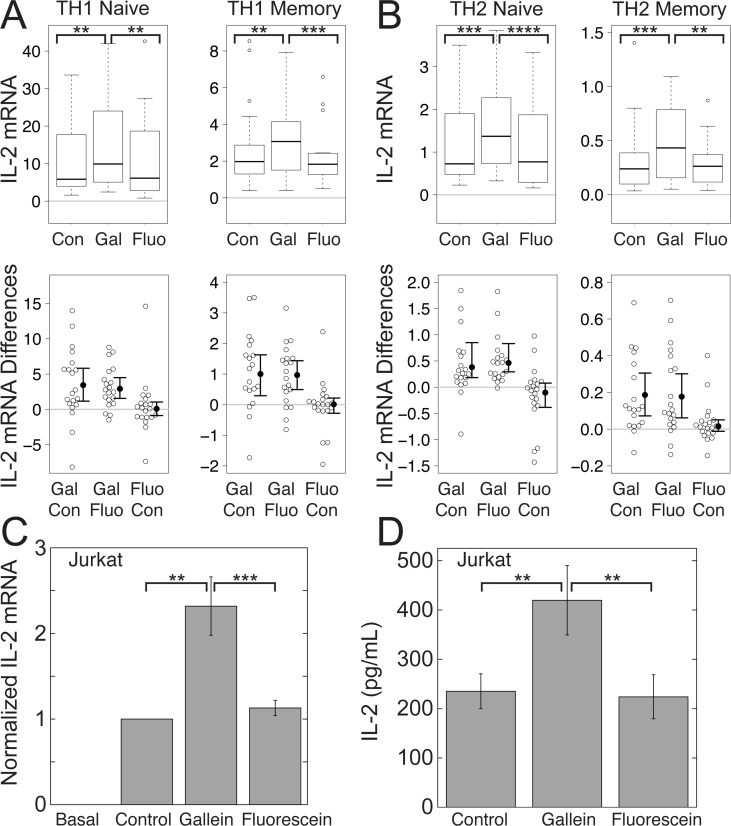
Figure 1. Gβγ inhibition with gallein enhances TCR-stimulated IL-2 increases in CD4+ T helper and Jurkat cells.
Gallein, but not fluorescein, potentiated TCR-stimulated IL-2 mRNA levels. (A) and (B) Box plots (top) and difference plots (bottom) show data from naïve and memory CD4+ T cells isolated from the peripheral blood of 20 healthy donors, stimulated with plate-bound anti-CD3 and soluble anti-CD28, and grown in conditions promoting TH1 (A) or TH2 (B) differentiation in the absence or presence of gallein or fluorescein for three days. IL-2 mRNA levels were determined by qPCR. In the box plots (top), the height of the box plots equals the interquartile range (IQR) and the horizontal line within the box indicates the median value. The whiskers extend to the lowest and highest data points within 1.5 X IQR and the open circles indicate the outliers. In the difference plots (bottom), open circles show pairwise differences in IL-2 mRNA for each sample when treated with the top versus bottom condition listed on the X axis. To the right of the open circles are the median values (closed circles) and 95% confidence intervals. (C) and (D) Jurkat cells were stimulated with plate-bound anti-CD3 and soluble anti-CD28 in the absence or presence of gallein or fluorescein for three days. (C) Data represent the mean ± SE from 17 experiments. IL-2 mRNA was normalized to the amount produced by the TCR-stimulated control. (D) The media was replaced with fresh media containing the same components on the second day, and IL-2 secreted between the second and third days was quantified by ELISA. Data represent the mean ± SE from 6 experiments. **, p < 0.01; ***, p < 0.001; ****, p < 0.0001.

