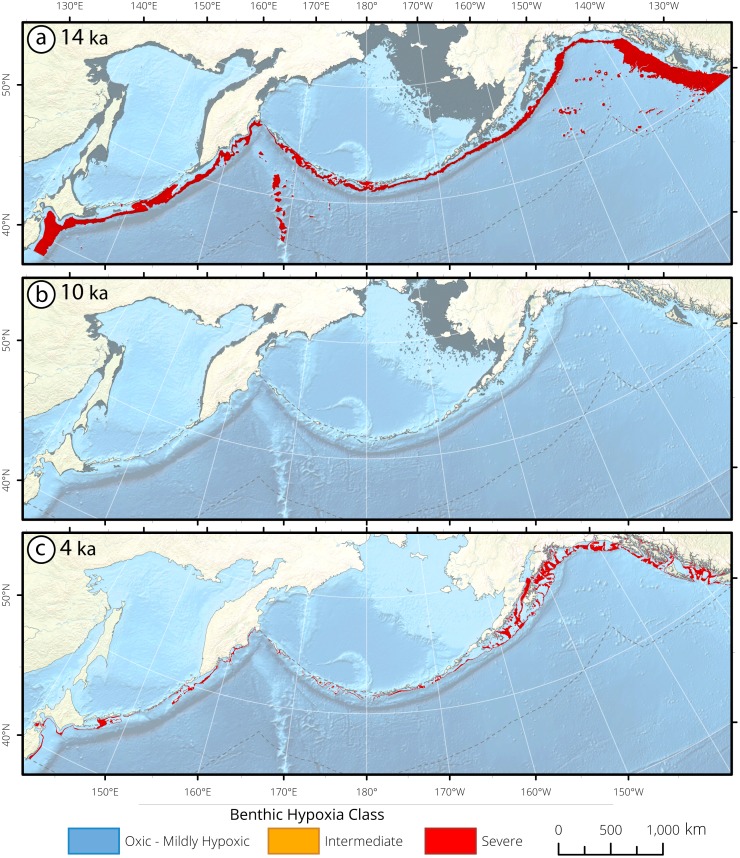
Figure 6. Subarctic Pacific bathymetric seafloor masks and surface area (km2) histograms of deglacial hypoxia impingement for (a) 14 ka, (b) 10 ka, and (c) 4 ka.
The Bering Sea and Sea of Okhotsk are not included in the analysis, due to their unique, regional-scale oceanography. Seafloor is selected between 0–3,200 mbsl, with a southern latitude limit at 38° 30′ N in the Western Pacific and 49° 30′ N in the Eastern Pacific with a northern limit along the Aleutian Arc. Analyses were limited to the continental margin within a 400 nautical mile buffer offshore of the continental coastline and the Aleutian Arc. The changing gray shoreline through the panels depicts the paleo-shoreline. At 14 ka, severe hypoxia ranged from 596–2,894 mbsl. At 10 ka, the water column was oxygenated, and at 4 ka severe hypoxia was found between 132–232 mbsl.

