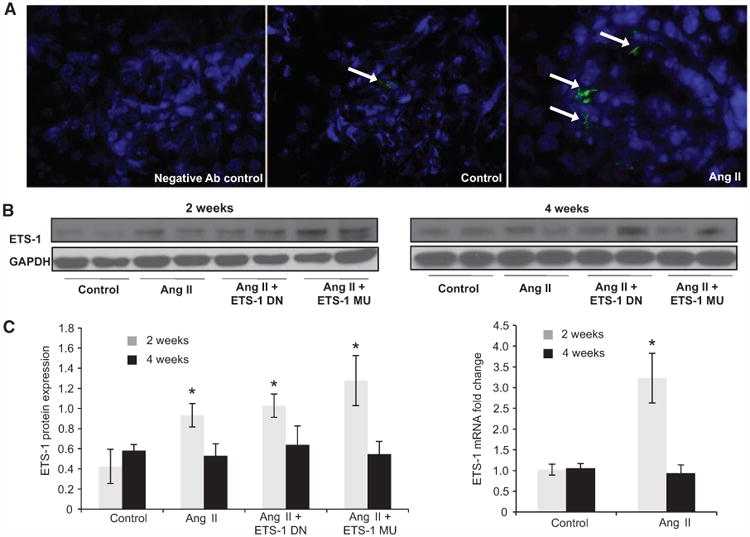
Figure 1.

Angiotensin II (Ang I)I increases cortical ETS-1 expression. A, Representative confocal photomicrographs showing low basal expression of ETS-1 (green) in control kidney cortex, which is predominantly glomerular and increased by Ang II. B, The renal cortical ETS-1 protein expression increases after 2 weeks of Ang II as assessed by Western blot (n=6, *P<0.05 vs control) and returns to baseline after 4 weeks of Ang II. The expression of ETS-1 was not significantly modified by treatment with either ETS-1 dominant-negative (ETS-1 DN) or ETS-1 mutant (ETS-1 MU) peptide. C, Densitometric analysis for ETS-1 showing significant increases in ETS-1 protein expression after 2 but not after 4 weeks of Ang II. Neither ETS-1 DN nor ETS-1 MU modified ETS-1 protein expression. Data expressed as mean±SEM are normalized to GAPDH (*P<0.05 vs control; #P<0.05 vs Ang II group; n=6). D, The infusion of Ang II for 2 weeks resulted in increases in cortical ETS-1 mRNA expression as assessed by real-time reverse transcriptase polymerase chain reaction (n=6; *P<0.05 vs control) and returns to baseline levels after 4 weeks of Ang II.
